DCS Analytics
Analytical chemistry · Windows desktop
Calibration you can defend in an audit.

CalibCurve replaces the spreadsheet your calibration currently lives in. Validated regression, statistics computed to standard, acceptance criteria enforced rather than remembered, and a complete audit trail — on your own machine, with no internet connection required.

€399 one-time · perpetual licence · per installation
Comparable capability in a LIMS starts around €5,000 per year. CalibCurve does the calibration part, once, for €399 — because most laboratories do not need the other ninety percent of a LIMS.
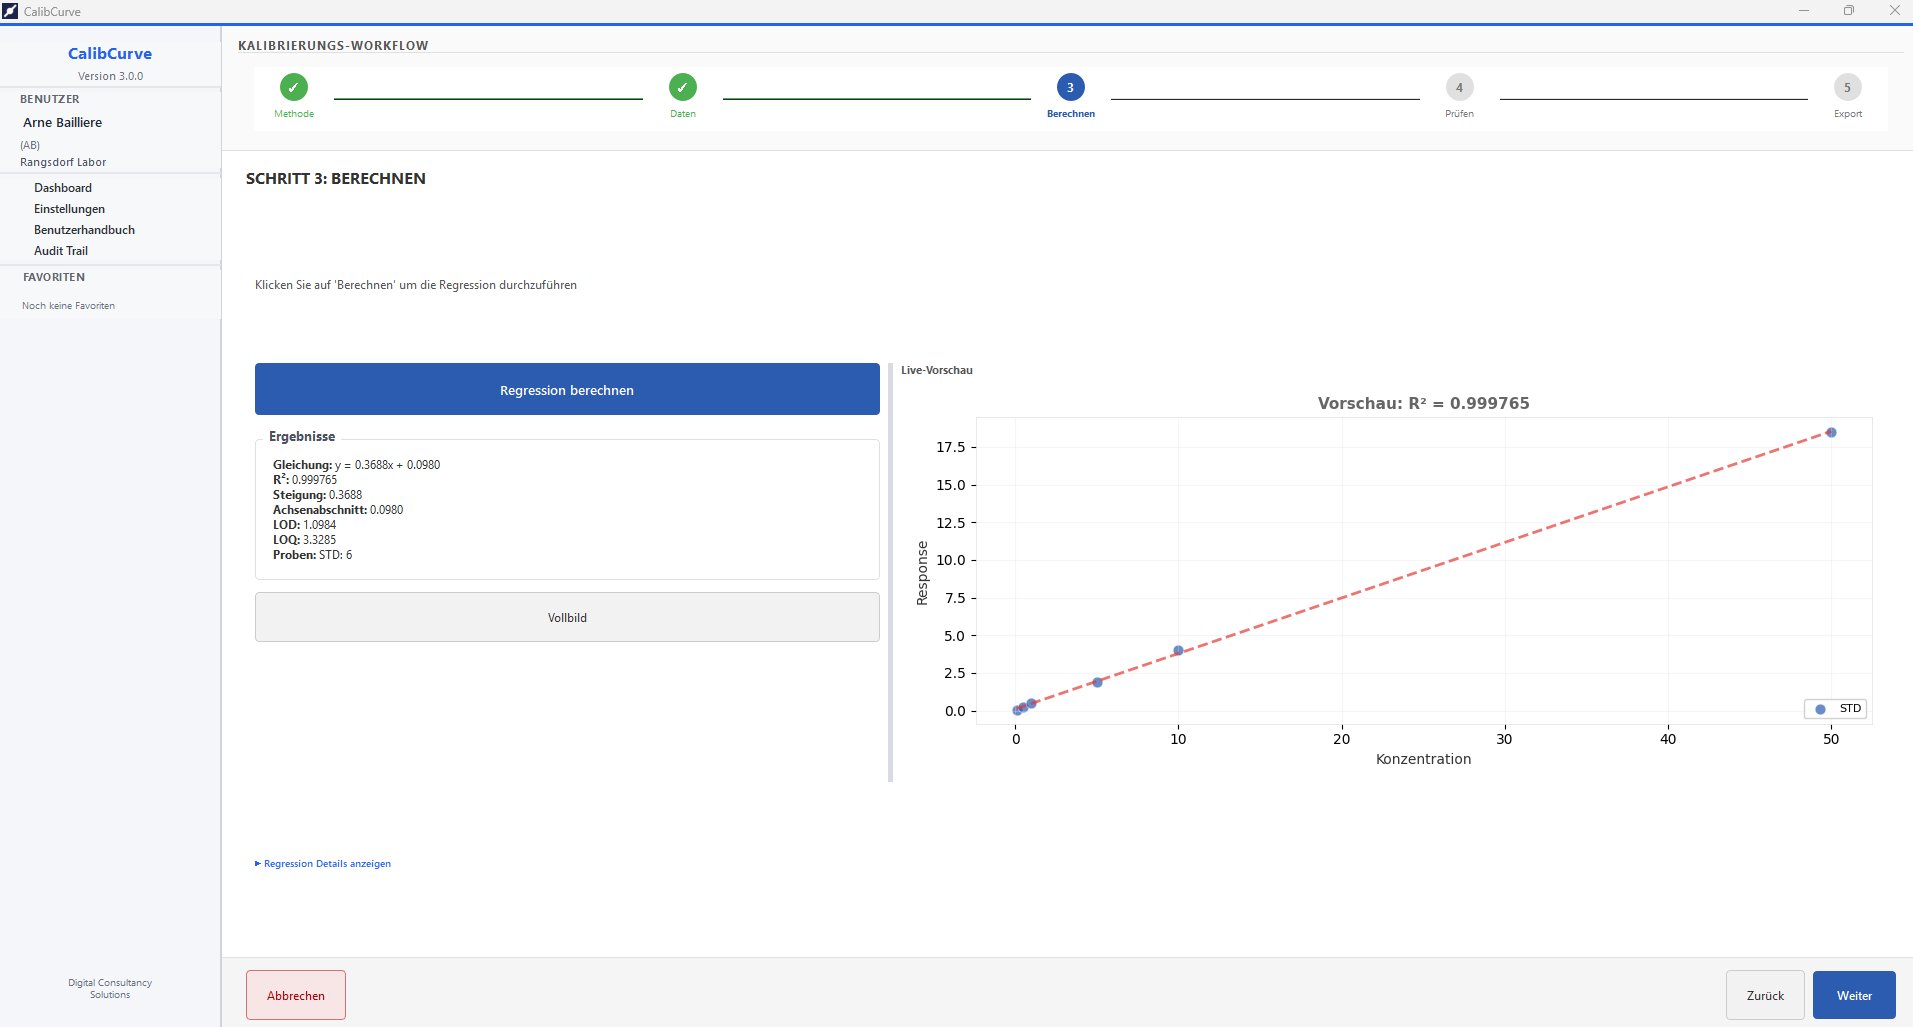
CalibCurve calibration workflow: five guided steps with regression results and live preview chart
The problem

Everyone knows the spreadsheet is a liability. Nobody has time to replace it.

Calibration in Excel works right up until somebody asks a question about it. Who changed this cell? Which points were excluded, and on what grounds? Is that LOD computed the way the method says? Was this curve ever actually accepted, or did it just get used?

×

Formulas nobody owns

The workbook was built by someone who left in 2019. It has been copied eleven times. Two of the copies have a different LOD formula, and no one is certain which is right.

×

Silent exclusions

A point gets deleted because it "looked wrong". There is no record that it existed, no reason attached, and no statistical test that justified removing it.

×

Documentation after the fact

The report is assembled by hand at the end, from numbers copied out of cells. Every transcription is an opportunity for an error that nothing will catch.

What CalibCurve does

Five steps, and the statistics are not optional.

Method, data, calculation, review, export. The workflow is deliberately linear because calibration is a procedure, not an exploration.

Regression that matches the method

Unweighted linear for standard work. Weighted 1/x and 1/x² where variance scales with concentration — LC-MS/MS, wide dynamic ranges. Four-parameter logistic for immunoassay and ELISA, where a straight line was never the right model.

  • Slope, intercept and regression equation with 95% confidence intervals
  • Pearson r and coefficient of determination R²
  • Standard error of slope and intercept, Student's t critical values
  • LOD and LOQ computed to DIN 32645 — 3.3·s/m and 10·s/m
Regression calculation step with live preview and R², LOD and LOQ results

Diagnostics that find the point you should have questioned

A high R² hides a great deal. CalibCurve runs the diagnostics that actually detect a bad calibration: residual patterns, leverage, and influence — so a single point quietly bending the whole curve is flagged rather than averaged away.

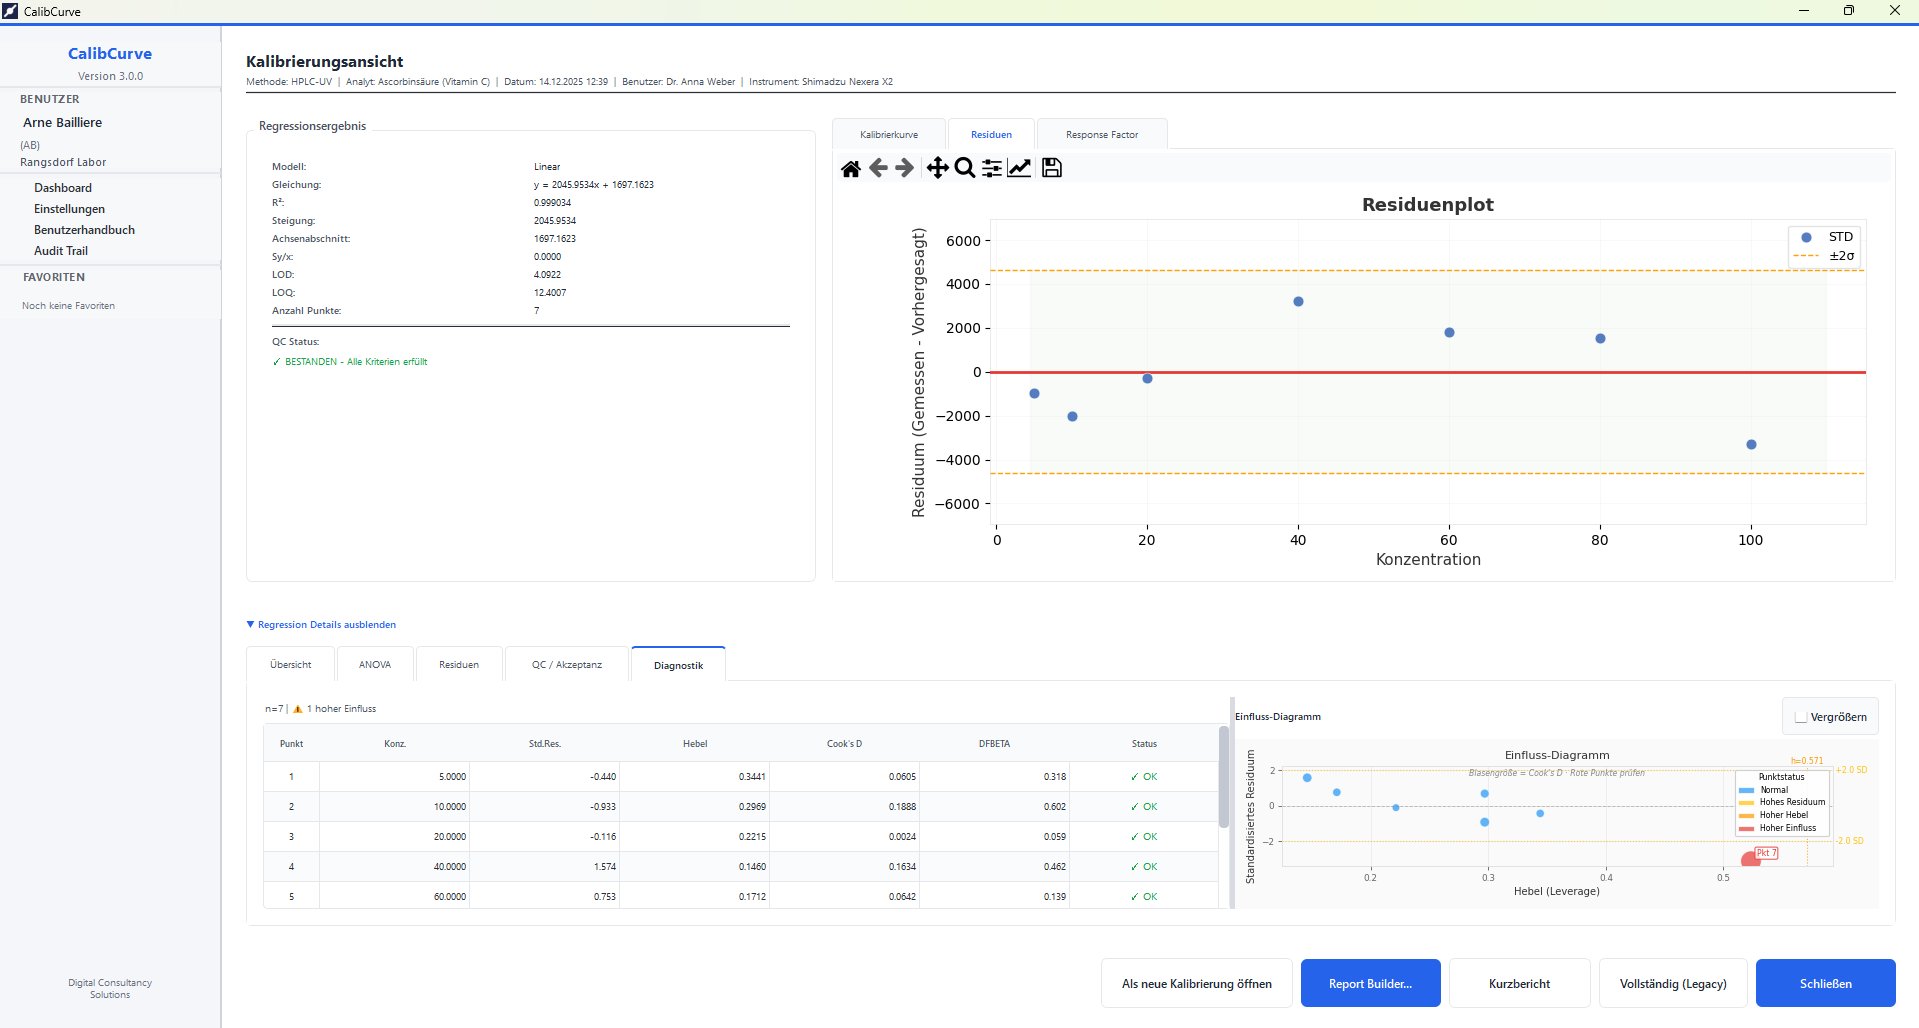
  • Residual plot with ±2σ bands and non-random pattern detection
  • Cook's distance, DFBETA and leverage per calibration point
  • Influence diagram — point status shown as Normal, High residual, High leverage or High influence
  • Full ANOVA table: sums of squares, degrees of freedom, mean squares, F-statistic, p-value
  • Response factor plot with ±20% acceptance band
Residual plot, ANOVA and influence diagnostics with Cook's D and DFBETA per point

Acceptance criteria the software enforces

QC levels are defined with the method, not decided afterwards. Low, mid and high controls are back-calculated against the curve, recovery and bias are computed, and the result is a pass or a fail against tolerances that were set in advance.

  • Automatic warnings: R² below threshold, F-test failure, non-random residuals, outliers beyond 2σ, intercept significantly non-zero, recovery outside limits
  • Configurable tolerances — typically ±10–15% at LLOQ and ULOQ, ±5% mid-range
  • Sample concentration calculator with back-calculation and recovery
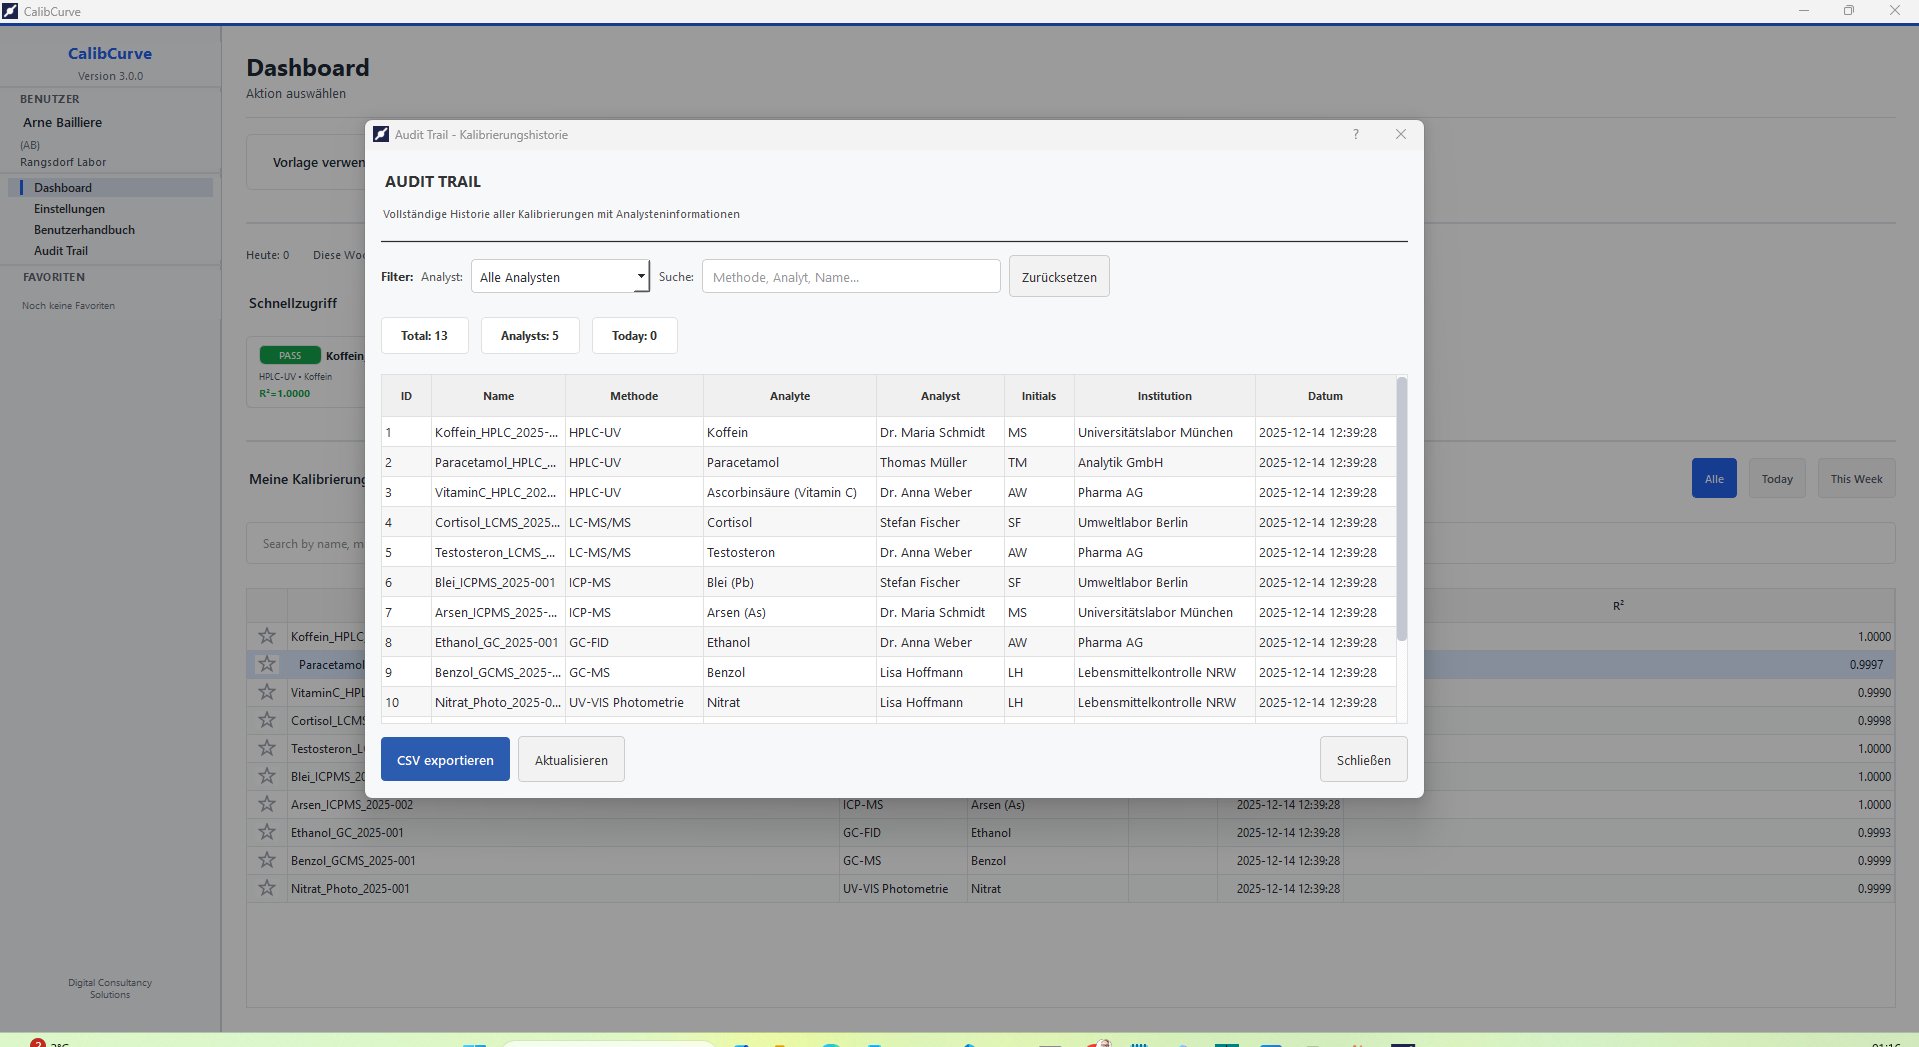
CalibCurve dashboard with audit trail listing calibrations, methods, analytes and analysts

The software proposes. The analyst decides.

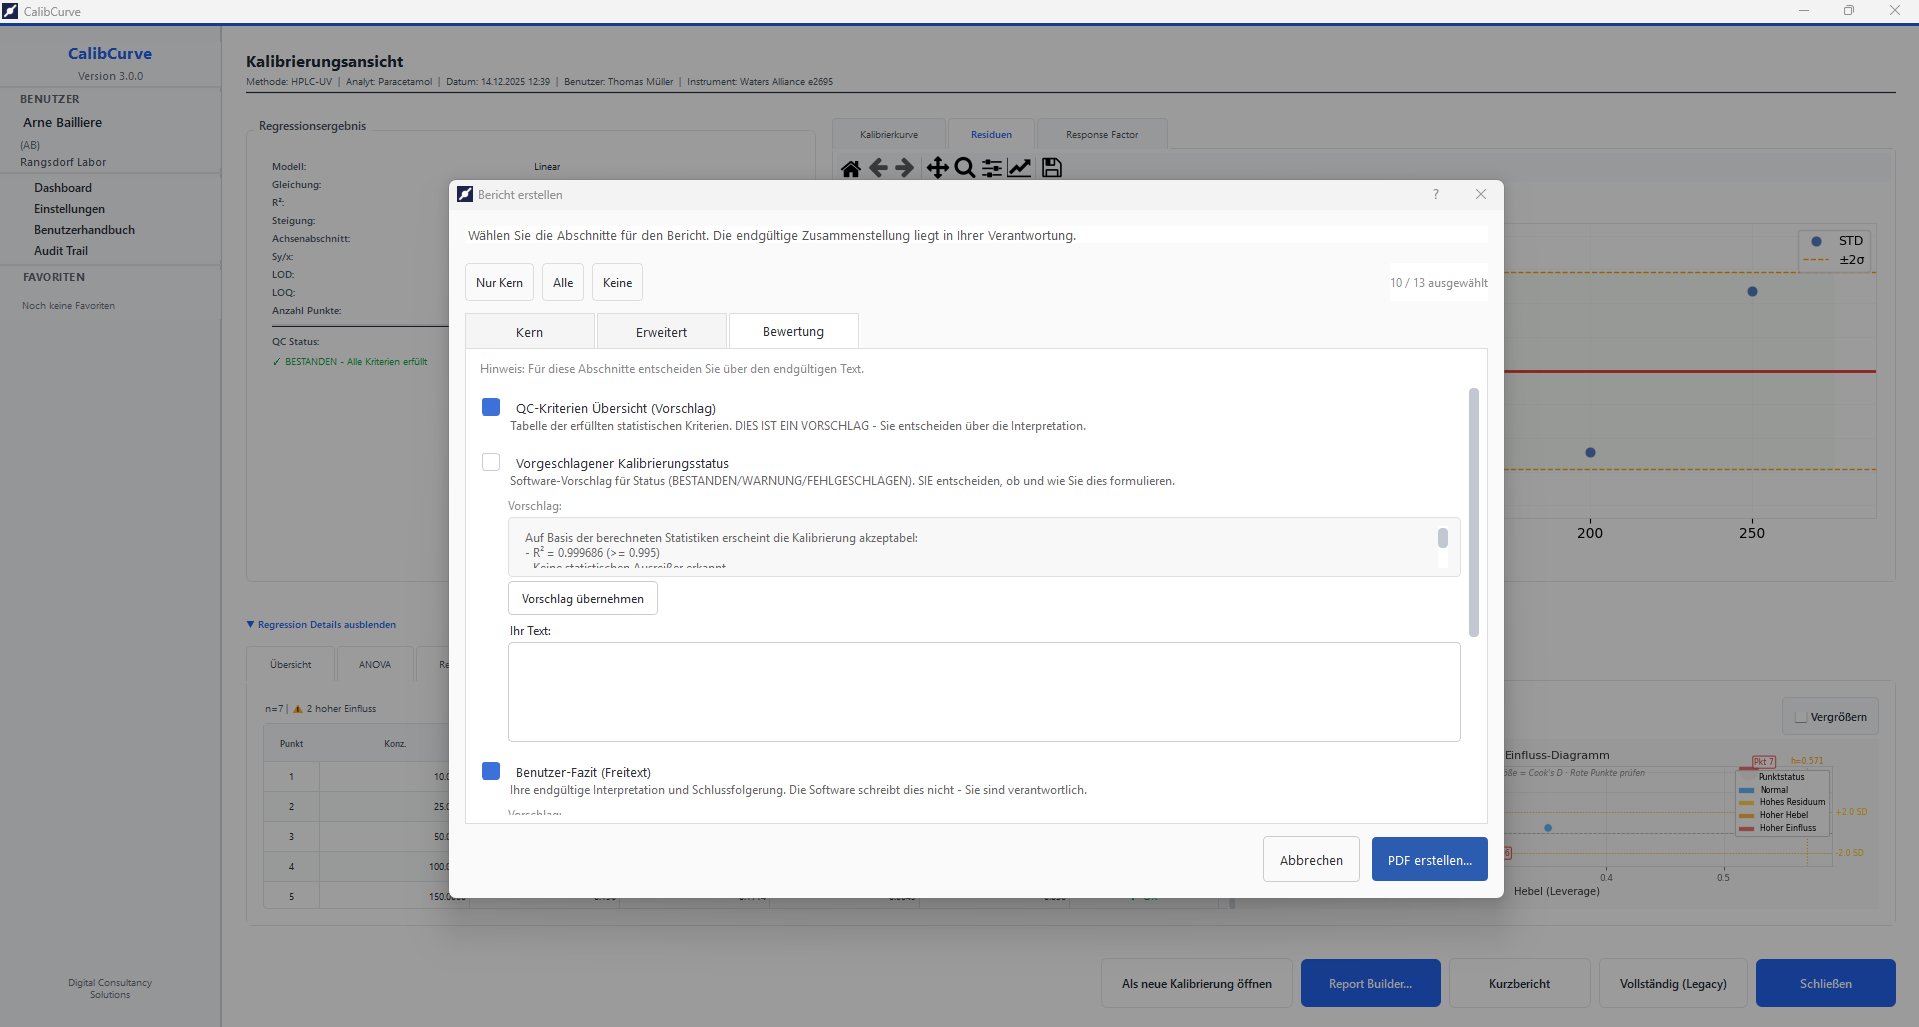
This is the part that matters for accreditation, and it is a deliberate design decision. CalibCurve will suggest a calibration status and offer wording for the QC summary — and it labels both, explicitly, as suggestions. The conclusion that goes into the report is written by the analyst, who is named in it.

  • Report builder with selectable sections — core, extended, assessment
  • Suggested status (Passed / Warning / Failed) shown as a proposal, never applied silently
  • Free-text analyst conclusion, required and attributed
  • Short report or full report, exported as PDF
Report builder with section selection and explicit wording that the analyst decides the interpretation
Method templates

Your technique is already in there.

Templates carry the regression model, units, QC levels and acceptance criteria for a technique, so a routine calibration starts configured rather than blank.

HPLC / UV

Paracetamol active-substance assay, caffeine in beverages, vitamin C. Linear and weighted models.

GC

GC-FID and GC-MS: ethanol in extracts, methanol in production samples, acetone in air samples.

ICP & AAS

ICP-MS copper in drinking water, ICP-OES zinc in soil, AAS iron in alloys.

UV-VIS photometry

Nitrate and phosphate determination, BCA and Bradford protein assays.

Bioanalytics

ELISA protein quantification with 4PL, enzyme activity, qPCR DNA copy number.

Titration & sensors

pH electrode and conductivity calibration, ISE fluoride, Ca/Mg hardness, TOC in water.

Who it is for

Laboratories that report results somebody relies on.

Pharmaceutical

Drug substance assays, dissolution testing, stability studies. QC and QA departments.

Environmental

Water quality — heavy metals and anions — soil contamination, air quality monitoring.

Food & beverage

Nutritional analysis, contaminant testing, routine quality control.

Clinical

Therapeutic drug monitoring and biomarker quantification.

Contract research

CROs and contract testing laboratories running many methods across many clients.

Academic & R&D

University laboratories and method development groups.

Specifications

Technical details

PlatformWindows 10 and 11, 64-bit. Desktop application — no browser, no server component.
InstallationSigned installer. Installs to a normal user profile; administrator rights not required for standard use.
ConnectivityFully offline. No internet connection required at any point, including activation. Suitable for isolated and validated laboratory networks.
LanguagesGerman and English, switchable in the application.
Regression modelsUnweighted linear · weighted 1/x · weighted 1/x² · four-parameter logistic (4PL)
StatisticsR², Pearson r, 95% confidence intervals, standard errors, full ANOVA, LOD/LOQ to DIN 32645, residual analysis, Cook's D, DFBETA, leverage
Data entrySpreadsheet-style table with paste from Excel. Up to three replicates per level with automatic CV%.
Data storageLocal database. Calibrations, methods, analysts and instruments retained with timestamps.
Audit trailComplete calibration history with analyst attribution, filterable and exportable to CSV.
ReportingConfigurable PDF reports — short or full — with embedded plots and a named analyst conclusion.
ComplianceDesigned to support ISO 17025 documentation practice. LOD/LOQ per DIN 32645.
LicenceOne-time purchase, perpetual, per installation. No subscription and no recurring fee.

A note on compliance wording: CalibCurve is built to support documentation practice under ISO 17025 and computes LOD and LOQ according to DIN 32645. It is a calculation and documentation tool. Accreditation belongs to the laboratory, and validation for a specific regulated use remains the laboratory's responsibility.

Questions

Frequently asked

What is CalibCurve used for?

It creates, evaluates and documents calibration curves for analytical instruments — replacing spreadsheet calibration with validated regression, standard statistics, enforced acceptance criteria and an audit trail. Used in pharmaceutical, environmental, food, clinical, industrial and academic laboratories.

Does it replace a LIMS?

No, and it is not meant to. A LIMS manages samples and workflows across a whole laboratory and starts around €5,000 per year. CalibCurve does the calibration part only, once, for €399. Many laboratories need rigorous calibration documentation without a LIMS implementation.

Which regression models are supported?

Unweighted linear, weighted 1/x and 1/x² for methods where variance scales with concentration such as LC-MS/MS, and four-parameter logistic (4PL) for immunoassay and ELISA.

How are LOD and LOQ calculated?

According to DIN 32645 — 3.3·s/m for the limit of detection and 10·s/m for the limit of quantitation, where s is the residual standard deviation and m the slope.

Is CalibCurve ISO 17025 certified?

Software cannot be ISO 17025 accredited; accreditation applies to the laboratory. CalibCurve is designed to support ISO 17025 documentation practice through its audit trail, analyst attribution, enforced acceptance criteria and standardised reporting. Validation for a specific regulated use remains the laboratory's responsibility.

Does it need an internet connection?

No. CalibCurve runs entirely offline — no connection is required to install, activate or use it. Suitable for isolated and validated laboratory networks. No data leaves the machine.

Is it a subscription?

No. One-time purchase of €399 for a perpetual licence per installation. No annual fee, no maintenance contract. Future major versions are optional paid upgrades, never a condition of continuing to use what you bought.

Does the software decide whether a calibration passes?

No. It computes the statistics and proposes a status — explicitly labelled as a suggestion. The analyst writes and owns the final interpretation, and is named in the report.

CalibCurve — €399, one-time

Perpetual licence per installation. No subscription, no annual maintenance fee, no cloud account. Online checkout is being set up and is pending payment-provider approval; until it is live, write to us and we will arrange invoicing, delivery and the licence key directly.